New Product Launch: The Playeasy Leaderboard and Enhanced Analytics and Reporting
What we built:
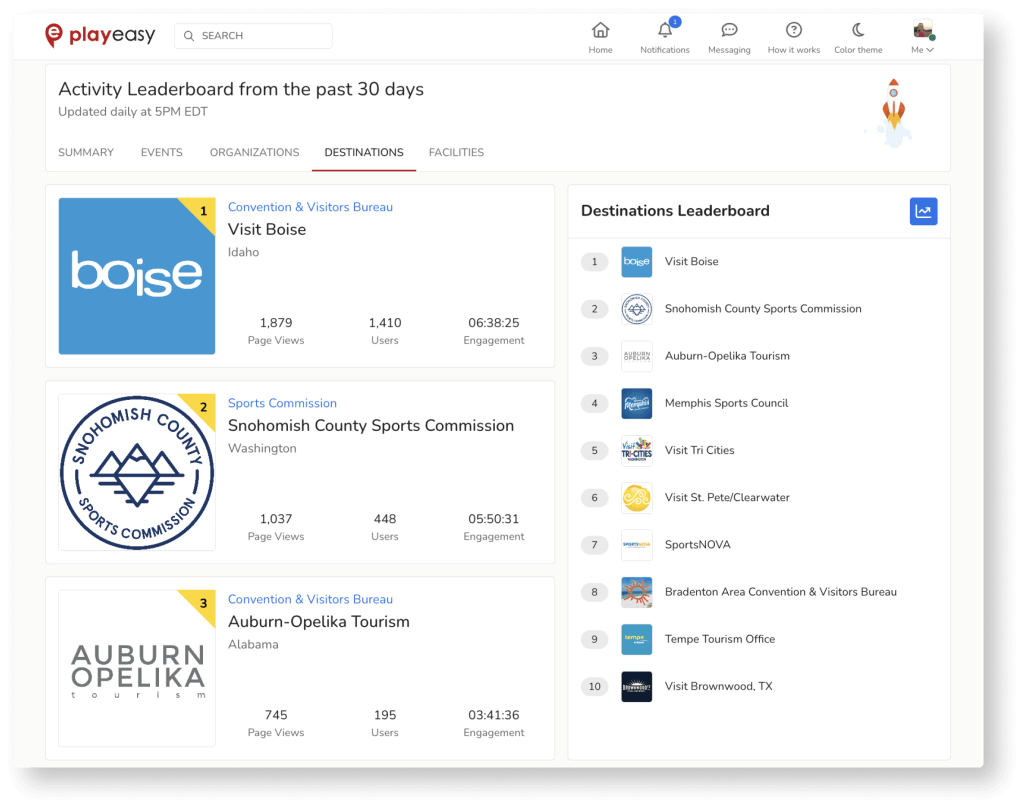
Who doesn’t love some competition? We’ve gathered real-time data across all of our content to show you who is succeeding the most on the Playeasy platform. Introducing Playeasy’s Activity Leaderboard. This dashboard displays the top 3 Trending Events, Organizations, Destinations, and Facilities on Playeasy daily, with key statistics including total page views, unique visitors, and total engaged time. Playeasy’s Leaderboard aggregates all traffic in which the related profile appears. For example, a Destination or Facility tagged on an event contributes to its overall traffic.

The Events, Organizations, Destinations, or Facilities tabs display the top 3 Trending profiles as well as an extended Top 10 Trending Leaderboard per category. Users can check the dashboard daily to see who is climbing the ranks and if their content is trending.
We’ve also updated how you can track your own success on Playeasy:
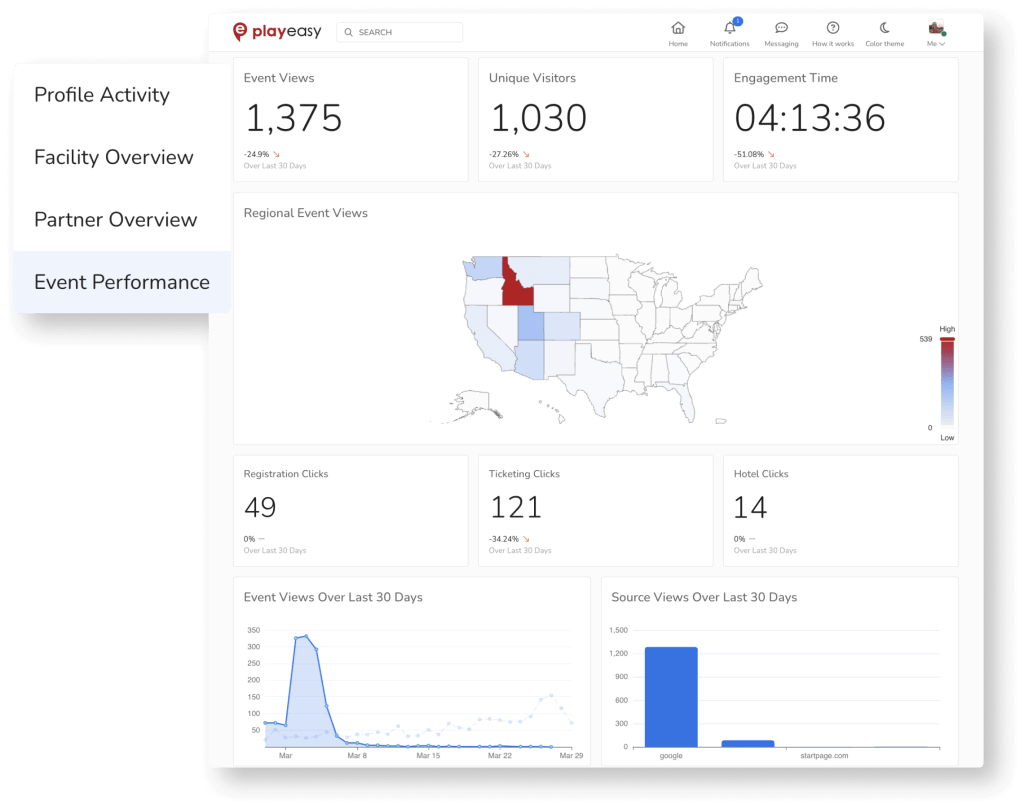
We enhanced our analytics to be even more robust than before. All Playeasy Destination, Facility and Organization profiles now have an enhanced ‘Reports’ tab on their Admin view. Managers can now view their profile’s overall activity, or choose to only view analytics on their facilities, local business pages, or marketed events.

These reports pages display total views across all facility, local business or event pages on this profile, as well as unique visitors and total engagement time (total time visitors have been actively scrolling or clicking on profiles). Additionally, Playeasy’s analytics tools now display registration, ticket, and hotel link clicks for events. Now, you can truly track your success and ROI with more targeted data.
Pro tips to rise to the top of the Leaderboards:
- Complete your profile – Fill out all of your profile tabs to create a positive visitor experience and rise up higher in Playeasy’s Marketplaces.
- Upload your Local Businesses – Promote your local businesses on your Destination profile & event pages to let visitors know where to eat, stay & play in one place.
- Create unique, interesting Playeasy posts – Be sure to include photo & video content.
- Market events – Add custom event pages with registration links to your profile & Playeasy’s Event Marketplace. These pages often get picked up by Google, bringing you lots of organic traffic.
- Sync Playeasy to your website – Add your Playeasy Events, Facilities, or posts to your website to automatically update in real-time and bring more views to your Playeasy content.
We can’t wait to see you rise up the ranks on Playeasy! As always, we are here to help. If you’d like to upgrade to unlock more features, please reach out here. Feel free to reach out to support@playeasy.com anytime with questions or feedback, or contact us here.
